How To Score 100% On Google Page Speed Test

So, you want to improve your website speed and score 100 on Google pagespeed test? We all do! In 2024, where website speed can make or break user engagement, hitting a 100% on Google PageSpeed Insights is crucial.
Making your website load fast helps you provide a seamless user experience and that might also help you get more leads from your website. We know speed is a massive ranking factor and we can’t miss it. Improving website speed and performance is a necessity for all websites given the incredible rise in the number of web users and websites.
If your web pages don’t load in less than 4 secs, you might be losing visitors or customers just because your site won’t load fast enough and people do not have enough time. Unsurprisingly, site speed is an important ranking factor for both desktop and mobile sites.
While there are other tools to measure website page speed, the go-to tool we would recommend is Google Page Speed Test Tool (we all know why!).
Tips to Score 100 on Google PageSpeed Insights
- Analyse your website URL in Google PageSpeed Insights to find out areas of improvement and work on improving Core Web Vitals.
- Choose a reliable and fast hosting partner for improved metrics like website load speed, server response time, first input delay and time to the first byte.
- Compress and resize images to maintain website size to a minimum.
- Minify scripts and codes to eliminate unnecessary data and processing time.
- Use Content Delivery Networks to ensure efficient and fast delivery of resources from different geographic locations.
- Use WordPress cache plugins to lower page load times for returning visitors.
Table of Contents
- Core Web Vitals in Google Website Speed Test
- What is Google PageSpeed Insights Made of?
- Why is CLS More Important in 2024?
- Steps to Score 100 in Google Page Speed Test Score
- The Truth About Scoring 100/100 in Google PageSpeed Insights
- Summary
- Google Page Speed Test – Frequently Asked Questions
Core Web Vitals in Google Website Speed Test
On June 2021, Google rolled out the Page Experience ranking factor supported by Core Web Vitals. Now the site performance no longer focuses only on website speed but also on user experience. Google now uses different metrics focusing on user experience as a ranking factor.
Google speed test measures website speed and performance in terms of Core Web Vitals; CLS (Cumulative Layout Shift) and LCP(Largest Contentful Paint).
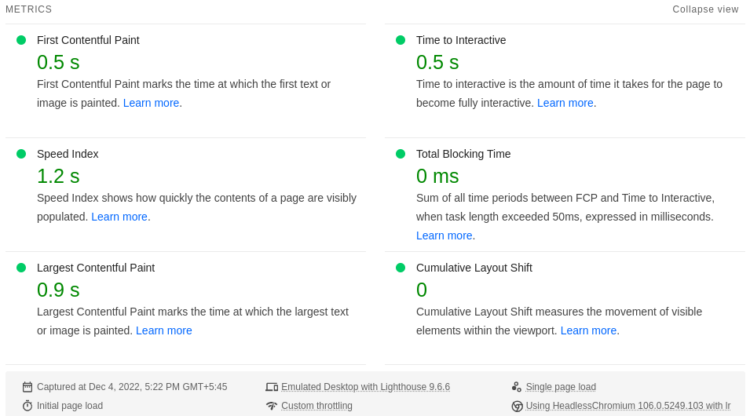
Google recently amended the page speed and performance metrics. Now, it weighs more on CLS and LCP. Why? Because most people can easily conquer the performance of a website. By adding a few cache plugins, they can increase the Google page speed score to 90+ on the Google Pagespeed Insights tool.
Nearly 70% of consumers admit that page speed impacts their willingness to buy from an online retailer. Unbounce, 2019
But, improving the Cumulative Layout Shift (CLS) score is a lot harder as it focuses on-page experience. However, this does not mean that other factors are less important.
What is Google PageSpeed Insights Made of?
Google pagespeed insights tool considers speed and user experience aspects of the website to calculate the score. There are alternatives like GTmetrix but Google PageSpeed Insights is the best free tool for beginners and is available for desktop & mobile devices. Measuring site speed using Google’s Tool is the first step in figuring out how the web page is currently performing and then we can look at specific areas of the pagespeed insights to improve speed and UX.
A lot of factors make up the actual site performance, page loading speed and overall user experience. So, measuring all factors can be challenging. Google PageSpeed Insights scores range from 0-100. Google Speed Test Tool score is measured based on these factors: First Input Delay, Largest Contentful Paint and Cumulative Layout Shift. There are other notable metrics as well: First Contentful Paint, Interaction to Next Paint and Time to First Byte. All of these factors combined with real-time and lab data in Google PageSpeed Insights give a picture of speed and user experience.
Search for and remove unnecessary redirects to improve time-to-first-byte (TTFB) and page speed.
First Input Delay (FID)
First Input Delay(FID) measures the time taken by your website to respond to any action like a sidebar scroll to start processing it. It’s also an official Google ranking factor and is also important in terms of website loading speed. Google marks this important as it’s a Real User Metric and can not be derived from lab data. FID is not much in our control as these data are collected from all web page users, but it can be improved to some extent.

FID is essentially the time it takes for a web page to become interactive or respond to user interactions like clicking or scrolling. So, it’s a measure of actual user experiences and web page performance. FID is an important metric for pages that intend interaction with users like purchases and lead form collection.
Complex Javascript codes, interactive pages and large websites often lead to Poor FID scores in Google pagespeed insights. Removing unused code and simplifying codes can be some of the best places to start to improve the FID score. But it’s not always easy to fix these issues and improve performance and you may also need professional website assistance.
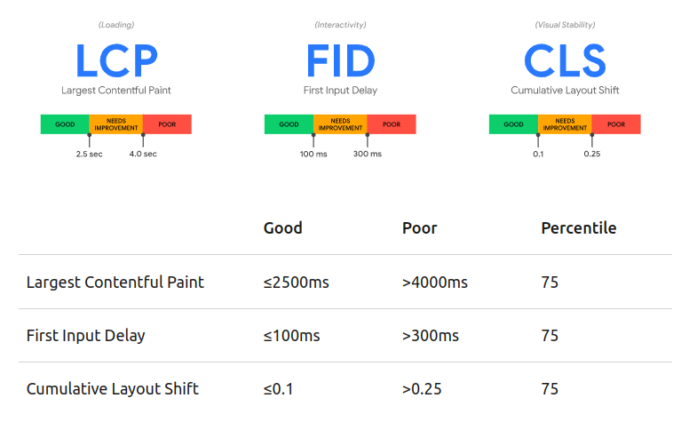
These are the scoring scale for FID in Google pagespeed insights:
- Good: 100ms or less
- Needs Improvement: 100-300ms
- Poor: 300ms or above
Largest Contentful Paint (LCP)
Largest Contentful Paint (LCP) measures the loading speed for the largest content on the web page. Ideally, the LCP value should be less than 2.5 sec. LCP does not measure the total webpage loading time but the time taken to load important parts of the website. The important elements may be videos, images or texts which are known to have a great impact on your website.
Properly sized and optimised images contribute to better LCP scores.
Previously, metrics like First Meaningful Content were in place but LCP has come into play since 2021. LCP is affected by server speed, slow-loading resources like images/videos, slow rendering and Javascript/CSS codes. Analysing loading processes and sequences can help figure out the largest element.
Pagespeed Insights tool helps you find the largest element on the website. Also, the image rendering sequence in the Google pagespeed insights gives an idea of what the largest element is on the website.

LCP is calculated in Google Pagespeed Insights based on Time to first byte (TTFB), Resource load delay/time and Element render delay. To improve LCP we must consider improving these individually as well.
- Good: 2.5 sec or less
- Needs Improvement: 2.5- 4 sec
- Poor: 4 sec or above
Cumulative Layout Shift (CLS)
Cumulative Layout Shift (CLS) is the page experience or what a user feels when they visit it. It measures when and by how much the elements in the page shift as the page loads. If the site is responsive and the layout is stable it has a good CLS score which is very close to zero. For sites running ads, this can be a common issue if the dimensions and positioning are not pre-defined.
CLS is all about user experience and it compares frames to know the layout shifts and their severity. Specifically, it is a measure of user experience focusing on stability, layout and design shifts. It is calculated as the multiple of the impact of and distance moved by unstable elements due to instability.
To work on improving the CLS on Pagespeed Insights score, we must find out what can cause these layout shifts. Some of the common reasons for layout shifts are;
- Images without specific dimensions
- Ads, third-party embeds and dynamic content
- Web fonts
- Overlapping contents
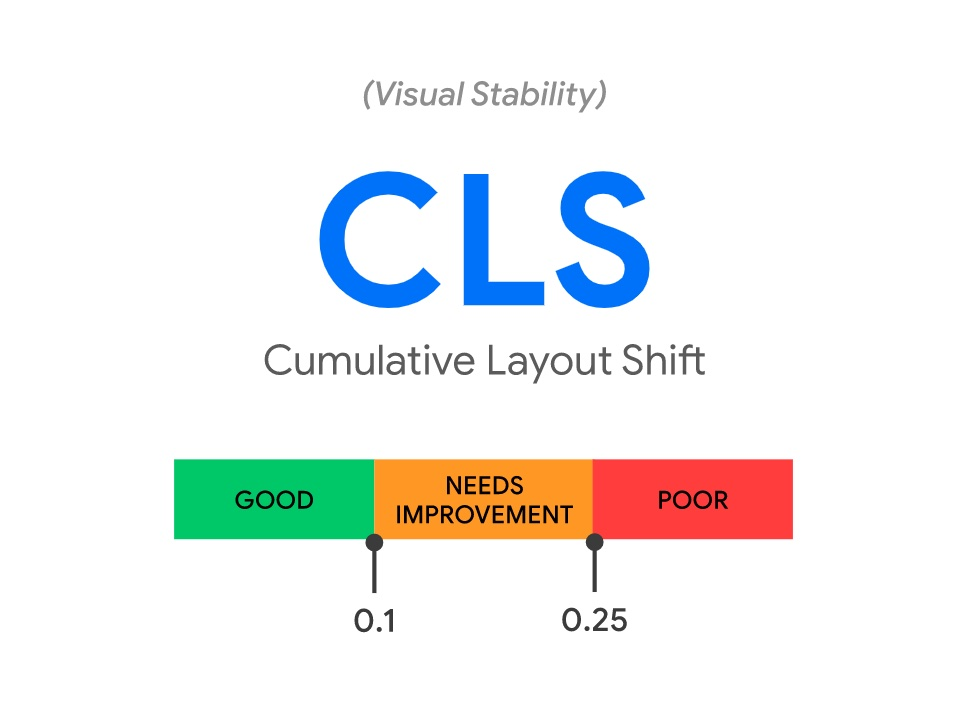
What is a good CLS score?
- Good: 0.1 or less
- Needs Improvement: 0.1 – 0.25
- Poor: 2.5 or above
Why is CLS More Important in 2024?
User experience is when a user visits your website and achieves a goal that you want them to achieve. If your website allows the user to easily achieve that task, then it has a better CLS score. Mobile friendly and responsiveness can be a few factors to keep in mind while optimising for better CLS.
Most WordPress sites are mobile friendly these days, check if yours is on Google Mobile Friendly test.
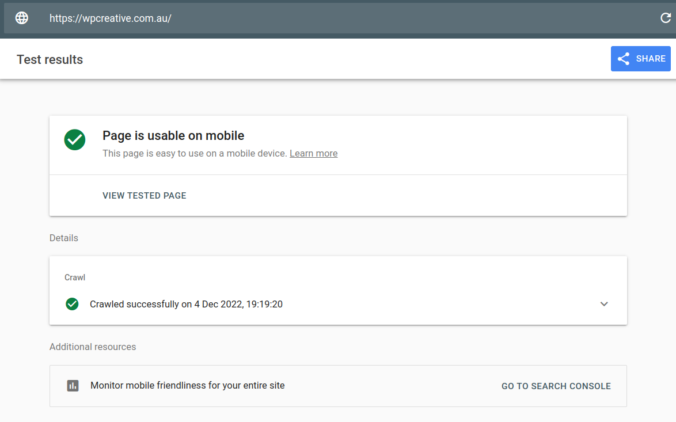
So, apart from the regular Google speed test performance tips, we are going to focus on how to improve the overall CLS score of the website.
CLS Score, Google Speed Test and Website Performance
CLS is a new metric and it looks at the stability of the website contents which then translates to a better website experience. Sometimes it may take a while for the website to be stable and usable which negatively affects user experience. One such example can be when a user is looking to click a button and it moves to lead to clicking on some other unintended link.
CLS can be measured from both Lab data and Field (Real user data) using Google Pagespeed insights. These issues can mostly be fixed by reviewing codes and resizing content to the right sizes. Responsiveness is another factor to look out for to improve CLS.
Try these WordPress Plugins for Site Speed Optimisation
- W3 Total Cache – Browser Cache
- Imagify or Smush – Image Compression, Optimisation & Lazy Load
- WP Super Minify to optimise JS, CSS and HTML codes
- Lets Encrypt – Free SSL
- Updraftplus – Backups
Steps to Score 100 in Google Page Speed Test Score
A whole lot of factors add up to make your site speed and performance. Slower sites result in higher bounce rates and chances of ranking are low. Optimising across all aspects for both desktop and mobile sites is a must for all websites.
The probability of bounce increases 32% as page load time goes from 1 second to 3 seconds.
– Think with Google
Here is a list of the 10 best Google page speed tips and tricks that you can implement on your website to achieve the perfect PageSpeed insights score.
Step 1. Improve Page Experience
The first thing you need to do is to improve your page experience. Let’s say you have a landing page with a form and a button. But there is just too much space in-between the two. So, what will the user do after filling in the form? What if the button is after three folds? They will simply not click the button.
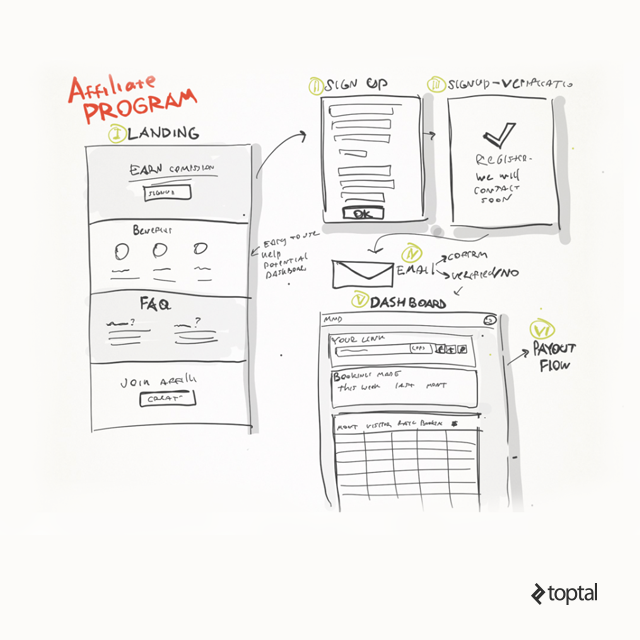
Improving page experience has no limits. We can implement a variety of approaches for it focusing on a variety of factors. It can range from implementing technical fixes like browser caching to changing fonts on the page. You can leverage Lab data from the Google Page Speed tool to analyse potential page experience enhancements. On the other hand, speed also directly affects page experience as faster and more responsive websites are preferred over slower ones.

So, make it easier for them to improve the overall page experience and make websites responsive. Good page experience helps to reduce bounce rate, and increase traffic. The better your page experience is, the better your conversion rate would be. With the majority of website visits coming from mobile devices, this is especially important for your mobile site.
Step 2. Increase Site Speed
Another thing you need to understand is that the site’s speed matters the most when it comes to the Google page speed test. If your web page takes more than 3 seconds to load, it will have a poor Google PageSpeed score and other speed testing tools. So, fix that first. You can increase the speed through several factors that we have already listed below.
Increasing site speed is not an easy task but it can be easy if you can find out and break down what exactly is making the website slow in the first place. There are some common areas to look out for and other ones specific to your website. Luckily, the Google pagespeed insights tool is here for your help.
If you are using WordPress, your low PageSpeed Insights score may be the result of your theme. Switch to a light and speed-optimised theme that fits your needs.
It will list the most recommendations and possible improvements which you can work on to increase your site speed score. You will need to work on improving almost all of these areas if you want to score 100 on Google pagespeed insights. It’s important to note that not all issues/improvements carry equal value. In most cases, it’s the balance of all the factors that contribute to the pagespeed insights score.
Common Improvements for Site Speed
The most common areas to look into for improving site speed are images, videos, unused codes, total website size, fonts being used, browser caching, overlapping contents, server response time and many more. If you are working on a WordPress site speed optimisation, plugins like W3Total Cache & Imagify will do most of your job.
Step 3. Get a Better Hosting Solution
Better hosting directly improves your page load speed so no wonder it should be chosen carefully. Your hosting solution should have a server-level cache available. If it is a shared hosting that you use, move to a better hosting solution.
A cloud hosting solution is the best way to improve your site performance. Like if I have a website on a shared hosting solution and it has a 3-second load time. I can easily improve the page load time to 2 seconds with optimisations in place and by moving it to a VPS or a cloud hosting solution.
A lot of your page performance depends on the hosting provider. Choose a hosting package that matches your website’s speed and storage needs to improve your site speed.
The hosting provider, package and server will directly impact your site’s performance. So, server response time, physical location, size, hardware and network requests capabilities are to be considered before buying hosting packages. Check if your server matches the demands of your website with the Google pagespeed insights tool.
Step 4. Reduce Image Resolutions
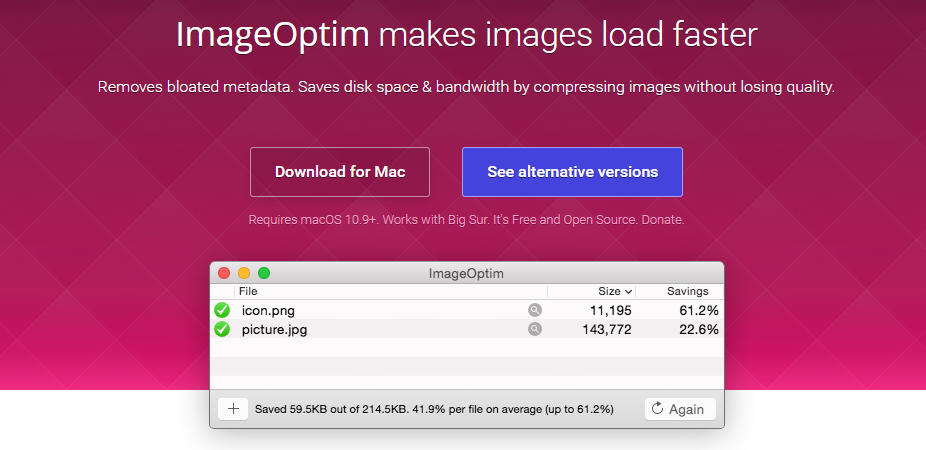
Images of your website play a crucial role in its performance. If your website has fine images – with a very high resolution – then they are going to become a problem for your website speed. What you need to do instead is to decrease their overall resolution through PhotoShop or any other image editing software.
This will decrease overall website size and the amount of data needed to download while visiting your site will be low ultimately making the website load faster. Mobile site speed and experience are hugely affected by the image and the overall website size.
Another option is to avoid the of use heavy file formats and use those suitable for less size and high quality. For WordPress users, there are plugins that you can use to compress or resize your images on the platform itself and even make them available in all the necessary minimal sizes. Images nowadays are generally large and using them on your website without resizing most definitely compromises your website speed.
If your website is built on WordPress CMS, you should take full advantage of WordPress plugins for lazy loading, CDN, compressing/resizing images and optimising resources. Apart from compressing and resizing new images, you should also focus on optimising old images (previously uploaded) in the media library. Some also go to the extent of converting videos to GIFs to reduce space.
Google developers have already created perfect image resolution editing software that you can use.
Step 5. Defer Script Loading
Script loading can decrease your site performance by 100 per cent. If you have too many scripts on your website, they are likely to reduce the overall performance. So, what you need to do is to decrease script loading on the site. You can defer the script loading by using Google tag manager.
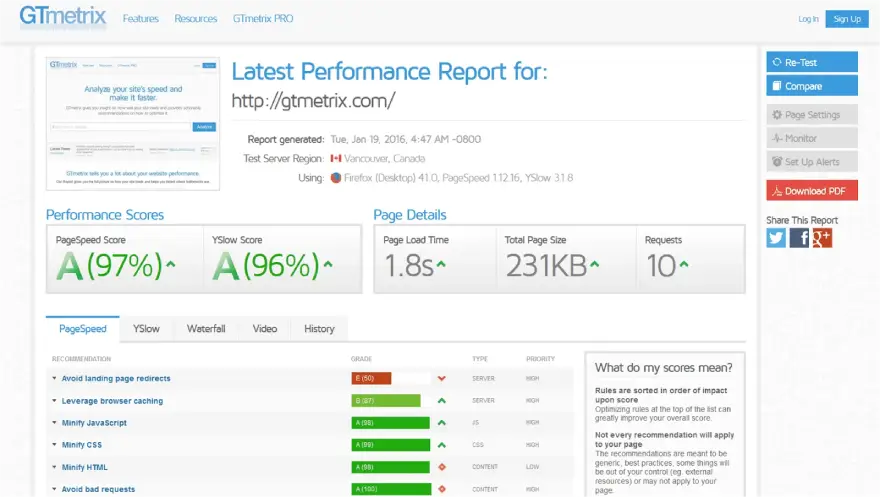
The tag manager allows users to easily select DOMContentLoad or Page Load to defer script loading. By deferring script loading, you are going to increase the overall page performance. You can even check the scripts that are leading to reduced speed on GTMetrix and Google Page Insights tools.
Step 6. Reduce TTFB
When you load a website, it loads by sending bytes to the client’s browser. The time it takes for the first byte to be received by the client’s browser is called Time to First Byte (TTFB). It affects both Google search results page ranking and website experience.
Common optimisations to reduce TTFB
The best way to improve your site’s performance is by improving the TTFB. Here are a few tips to increase the byte rate.
- Reduce the resolution of each image on the page
- Defer scripts on the site that load before DOMContentLoad
- Increase server response time
- Leverage CDNs
- Add more textual content and fewer images to reduce loading time
- Reduce HTTP requests
Step 7. Use a Content Delivery Network (CDN) & SSL
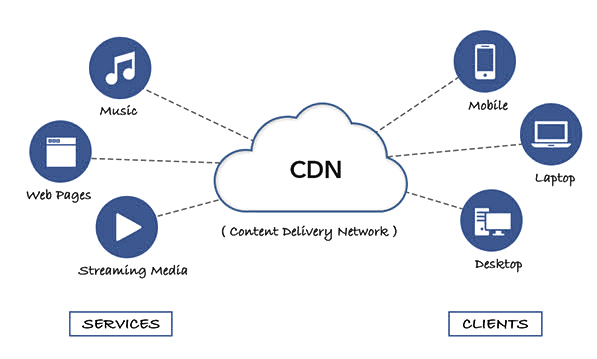
If you don’t have a CDN available on your website, then the best way to improve a few seconds of load-time is by adding a good CDN network to your website. CDN works with your host to distribute your site across strategically chosen data centres so that they can be accessed faster.
You can use Cloudflare CDN on your website if you are just starting because it is completely free to use. Since Cloudflare automatically provides an SSL to the users, you can use that SSL on the site to improve overall performance.
If you are not using Cloudflare, you can use another decent SSL certificate provided for your website. This can be a Let’s Encrypt free SSL provider.
Step 8. Minify JS, HTML, and CSS
Codes written on a website can also become a hurdle in site performance. If a website has HTML, CSS, and JavaScript with too much spacing. Each of that spaces would count as a single bit. Now combine thousands of such bits, and they turn into bytes. This all combined can take up a lot of space.
You don’t have to be a developer to minify JS, HTML and CSS codes in WordPress. Hundreds of plugins are available in the WordPress plugin store. Just don’t forget to back up before making changes in case your site breaks down or malfunctions.
You can minimise these codes and save as much as 100kbs of speed. If you are using WordPress, using a decent minifying plugin can help reduce the spacing and unnecessary line breaks in the code. These optimisations in scripts and codes in turn decrease the overall file size smaller. Minifying codes may not always translate to efficiency and it may sometimes also break the site when implemented through plugins.
Step 9. Improve Server Response Time
Make sure that your server is working at its peak performance. I said earlier to use a decent hosting solution because of the server response time. If a server has the bandwidth, processor, and RAM, it is more likely to have a decent response time.
You can measure the server response time with Cloud Harmony. The tool provides the overall server response time of multiple public cloud servers such as Vultr, Google Cloud, AWS, and DigitalOcean. It is a great way to choose the best server for your website.
Read our blog – Improve your speed up your WordPress website without plugins.
Step 10. Run a Performance Audit
Finally, run a timely performance audit of the website once it is completely developed. You need to run a performance audit every month just to make sure that the site is working at its best. To start with:
- Check the site performance with the best performance tools
- Check for downtime
- Check for top page errors on Google Search Console
- Check for site redirection issues
- Check for pages with the biggest page size
- Check for images that are bigger than 100kbs in size
- Check for scripts on the homepage and other prominent pages of the site
- Check for CRO issues
- Track the overall user journey report and find ways to improve it
That is it. This is the complete website performance audit that you should do every month to keep your site performing at its best on Google Pagespeed Insights.
The Truth About Scoring 100/100 in Google PageSpeed Insights
While it’s certainly possible to score a 100/100 on Google PageSpeed Insights, it’s not necessarily indicative of a fast website. In fact, many high-performing websites have scores in the 80s or 90s.
There are several reasons why your website might not score a perfect 100. Some common factors that can lower your score include:
- Heavy use of images or videos
- Use of custom fonts
- High numbers of HTTP requests
- Slow server response time
If your website is scored in the 70s or 80s, there are still many ways you can improve its speed. Some simple steps include optimising images, reducing HTTP requests, and minifying JavaScript and CSS files.
If you’re having trouble improving your website’s speed, consider using a caching plugin or hiring a dedicated WordPress developer to help you optimise your site.
Summary
No wonder, it is definitely not easy to keep up with all of these optimisations and a 100% score should not be your only goal. Scoring 100% on PageSpeed insights will not always translate to an excellent page experience and rankings. Based on your website’s need and priority, you can figure out ways to improve performance.
Speed and Google PageSpeed insights only include a few of the many factors required to help your website rank in the SERP. And even if you rank, it does not guarantee conversions or even traffic. So, make sure to put in the right mix of efforts to ensure efficient results.
But make sure to keep these tips in mind if you are checking for ways to improve your Google PageSpeed Insights score or if want your site to load faster. Also, do not forget that not one approach fits all. Every website is different and it may also take other unique optimisations to improve your site’s performance.
Google Page Speed Test – Frequently Asked Questions
How do I test Core Web Vitals?
Tools for measuring core web vitality. Use the new Core Web Vital report from Search Console to identify the pages in which the search results are most needed. Once you have determined which page needs repair, use PageSpeed – Insights to detect Lab and Field Problems.
What happens if you fail Core Web Vitals?
Web Vitality is just a list. All of these must pass for your rank increase. Passing LCCP or FID does not affect your rankings. Updated: Google says the situation has shifted.
What is a good page speed insight score?
A score above 90 can be described as good. The score of 50-89 needs improvement, while the lower the score the less.
Is PageSpeed Insights reliable?
Google page speed analytics are pretty accurate and reliable now to measure user experience. The different metrics provided help you see exactly how the users interact. It was able to improve its reliability through recent changes.
What is Lighthouse in Google Chrome?
Lighthouse is a tool that helps you audit and improve the quality of your web pages. It runs in Chrome Developer Tools and can help you with everything from performance to accessibility. It runs a number of automated checks on your page and then gives you suggestions for improvement.
It is also available as an extension in the Chrome web store. You can use it to audit any page, from simple pages with few resources to complex single-page applications containing thousands of lines of code. With Lighthouse, you can quickly identify and fix performance issues
How do I access Google Lighthouse?
To access Lighthouse in Chrome Developer Tools, open the Developer Tools panel and select the “Lighthouse” tab. You can also use the Lighthouse extension in the Chrome web store.
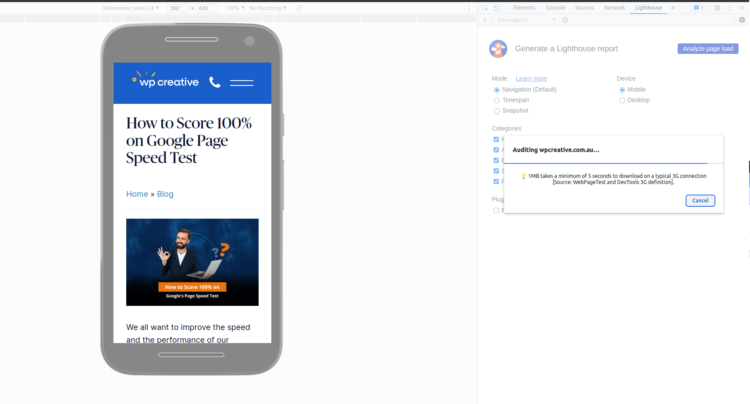
To audit, a page with Lighthouse, open the page in your browser and then open Developer Tools. In the Developer Tools panel, select the “Lighthouse” tab. Click the “Start audit” button and wait for Lighthouse to finish analysing the page. When it’s done, Lighthouse will show you a report of its findings.
What is a good score on Core Web Vitals?
A good score on Core Web Vitals is anything above 90%. This indicates that your website is running smoothly and meeting the basic requirements for a website. Anything below 90% could indicate potential problems that need to be addressed.
A score of 90-100% is considered excellent, while a score below 50% indicates that your website needs urgent optimisation work. It is important to keep an eye on your Core Web Vitals scores regularly and take action to improve the performance of your website. By doing this, you can ensure that your visitors have an enjoyable experience when they visit your website.
Finally, remember that the Core Web Vitals scores are just one part of a larger whole. Along with other performance measures such as page speed, caching, and server response times, you should always strive to optimise your website for the best possible user experience. With the right optimisation techniques and regular monitoring, you can ensure that your website is running smoothly and reliably.
How do I read PageSpeed Insights?
PageSpeed Insights will analyse the page and give you a score from 0 to 100, as well as recommendations for improving its speed.
You can view more detailed information about each recommendation by clicking the Show More link. This will open a new window with more information about the recommendation, including how to fix it.
If you’re looking to improve the speed of your website, PageSpeed Insights is a great tool to help you get started.
How do I use Google Mobile-Friendly Test?
Google Mobile-Friendly Test is a tool that helps you check how your website looks on mobile devices and gives you tips on how to make it look better.
To use the tool, simply enter the URL of the website you want to test into the search bar and click the Analyse button. The tool will then analyse your website and give you a score from 0 to 100, as well as recommendations for improving its mobile friendliness.
You can view more detailed information about each recommendation by clicking the Show More link. This will open a new window with more information about the recommendation, including how to fix it.
Is Google mobile-friendly test free?
Google offers a free mobile-friendly test that you can use to determine how mobile-friendly your website is. The test is easy to use and takes just a few minutes to complete.
How to increase mobile site page speed in WordPress?
If you’re using WordPress, there are several ways to improve your mobile page speed. One of the simplest ways is to use a caching plugin like WP Super Cache, WP Rocket or W3 Total Cache. These plugins will help to reduce the number of HTTP requests your website makes, which can improve your page speed.
Another way to improve your mobile page speed is to use a responsive theme. A responsive theme will automatically adjust to the screen size of the device being used, which can help to improve loading times.
Still struggling to increase your Google PageSpeed Score? Check out our Website Speed Optimisation Service in Sydney for professional help.
